
DATA TO DASHBOARD : POWER BI / POWER BI DATA ANALYST
Objective
- Introduction to Power BI
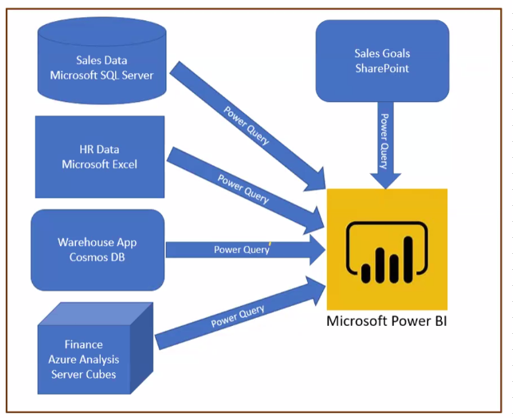
- Data Discovery and Import
- Data Modeling and DAX
- Visualizations and Reports
- Power BI Service and Dashboards
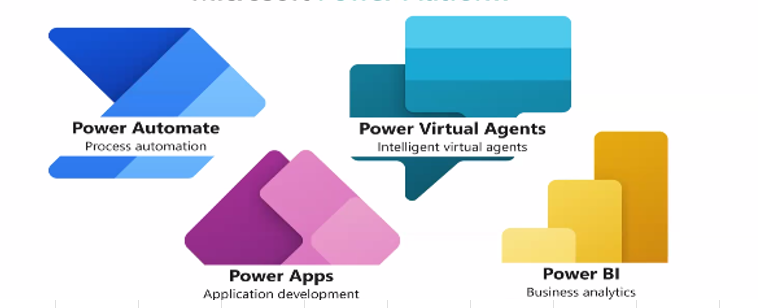
QUICK INTRODUTION TO POWER PLATFORM


Power BI is a service, products, or platform provided by Microsoft that lets you visualize, share, and discover data from different sources.
- Chats
- Graphs
- Reports
Saa S Service to publish Power BI Reports through Dashboards
Mobile Apps for Windows 10, IOS and Android

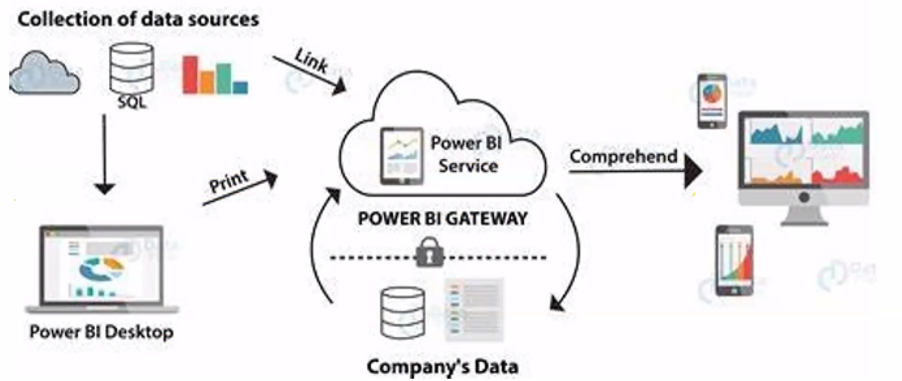

The first step in the data analysis process is identifying and getting data.

- Data Analysis Expressions (DAX).
- Developed by Microsoft.
- A library of function and operators.
- Build formulas and expressions.
- Create calculated tables, columns, and measures.

Measures:
Measures are a summarization of data. A way of defining aggregate calculations on data. Often called
“Calculated Measures”
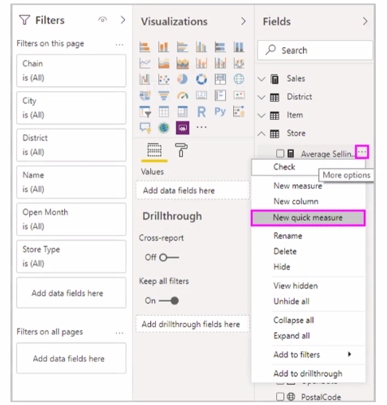
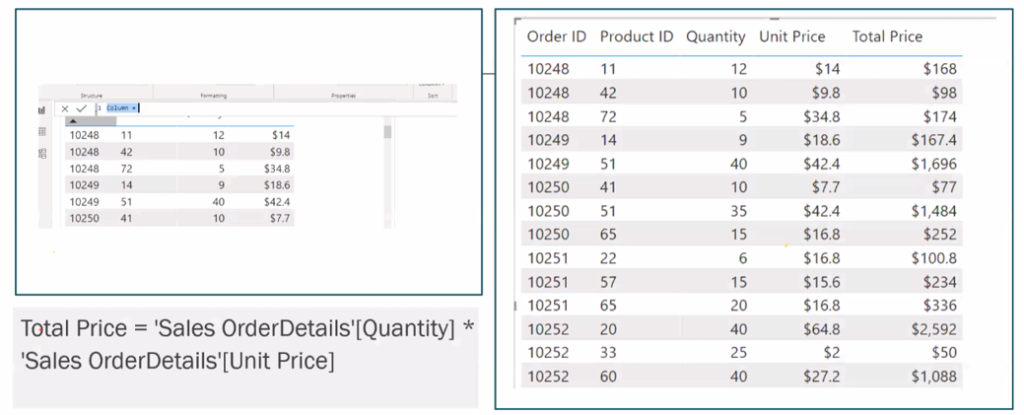
Calculated Columns
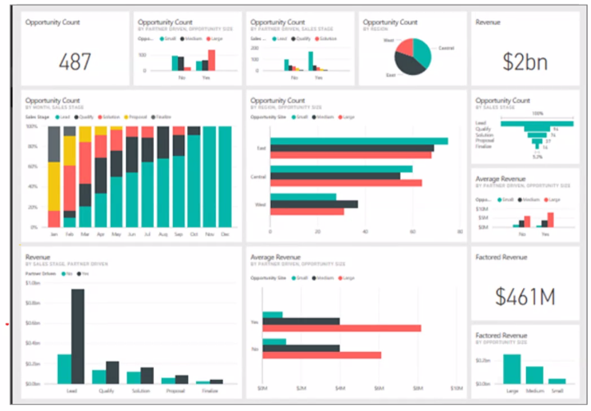
Introduction to Dashboards
A Dashboard:
Is a single-page canvas that tells a story through visualization. Can draw from multiple Reports. Contains no Filter, Visualization, or Fields pane. Does not display the underlying dataset.